
The investment challenge is a growing point of tension in risk assets between momentum and overvaluation. Assets with the strongest fundamentals have the most stretched relative valuations, and vice versa. The economic and policy risks for 2025 will help determine whether momentum or valuations dominate investment returns in the coming year.
Source: Vanguard
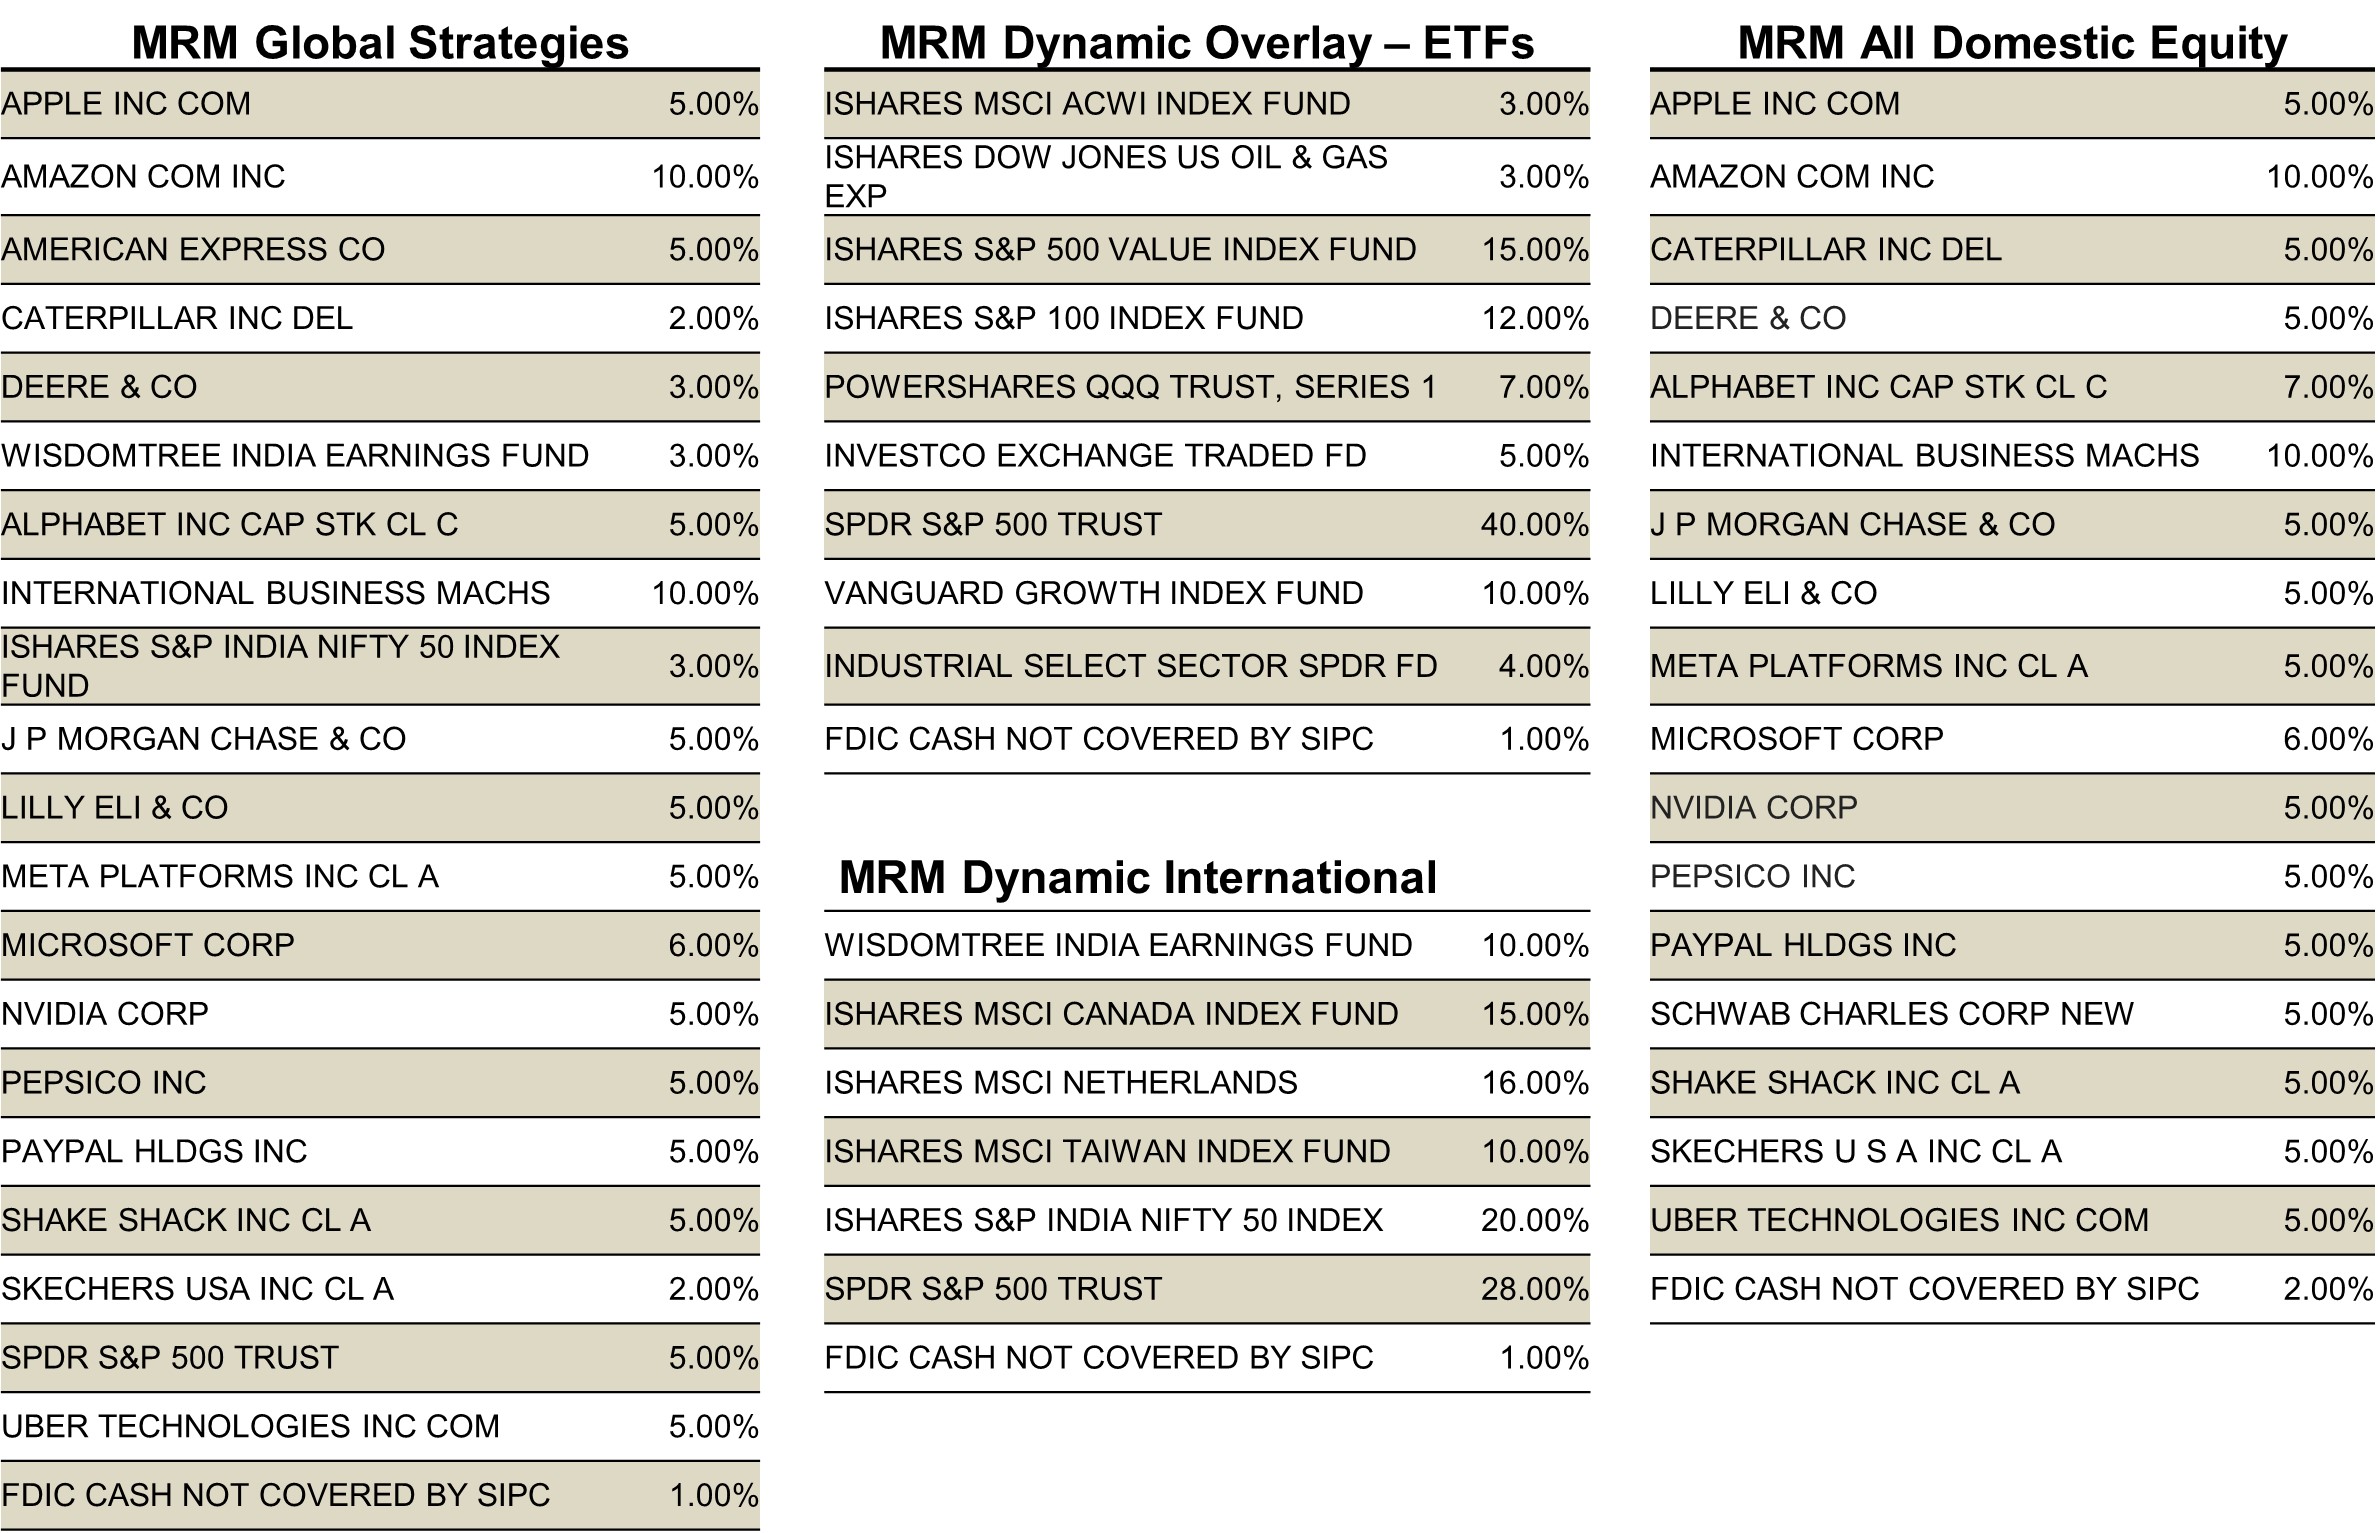
MRM Group, Inc. (“MRM”) is a state-registered investment advisor and an independent management firm that is not affiliated with any parent organization. Using quantitative selection methods, each MRM strategy searches within a well-defined universe of securities, using consistent investment criteria to identify attractive investments and create diversified portfolios. MRM seeks to provide long-term capital growth.
The portfolios do NOT use inverse or leveraged ETFs. Universe vehicles may change, from time to time, when approved by the principal of MRM Asset Allocation Group at its sole discretion.
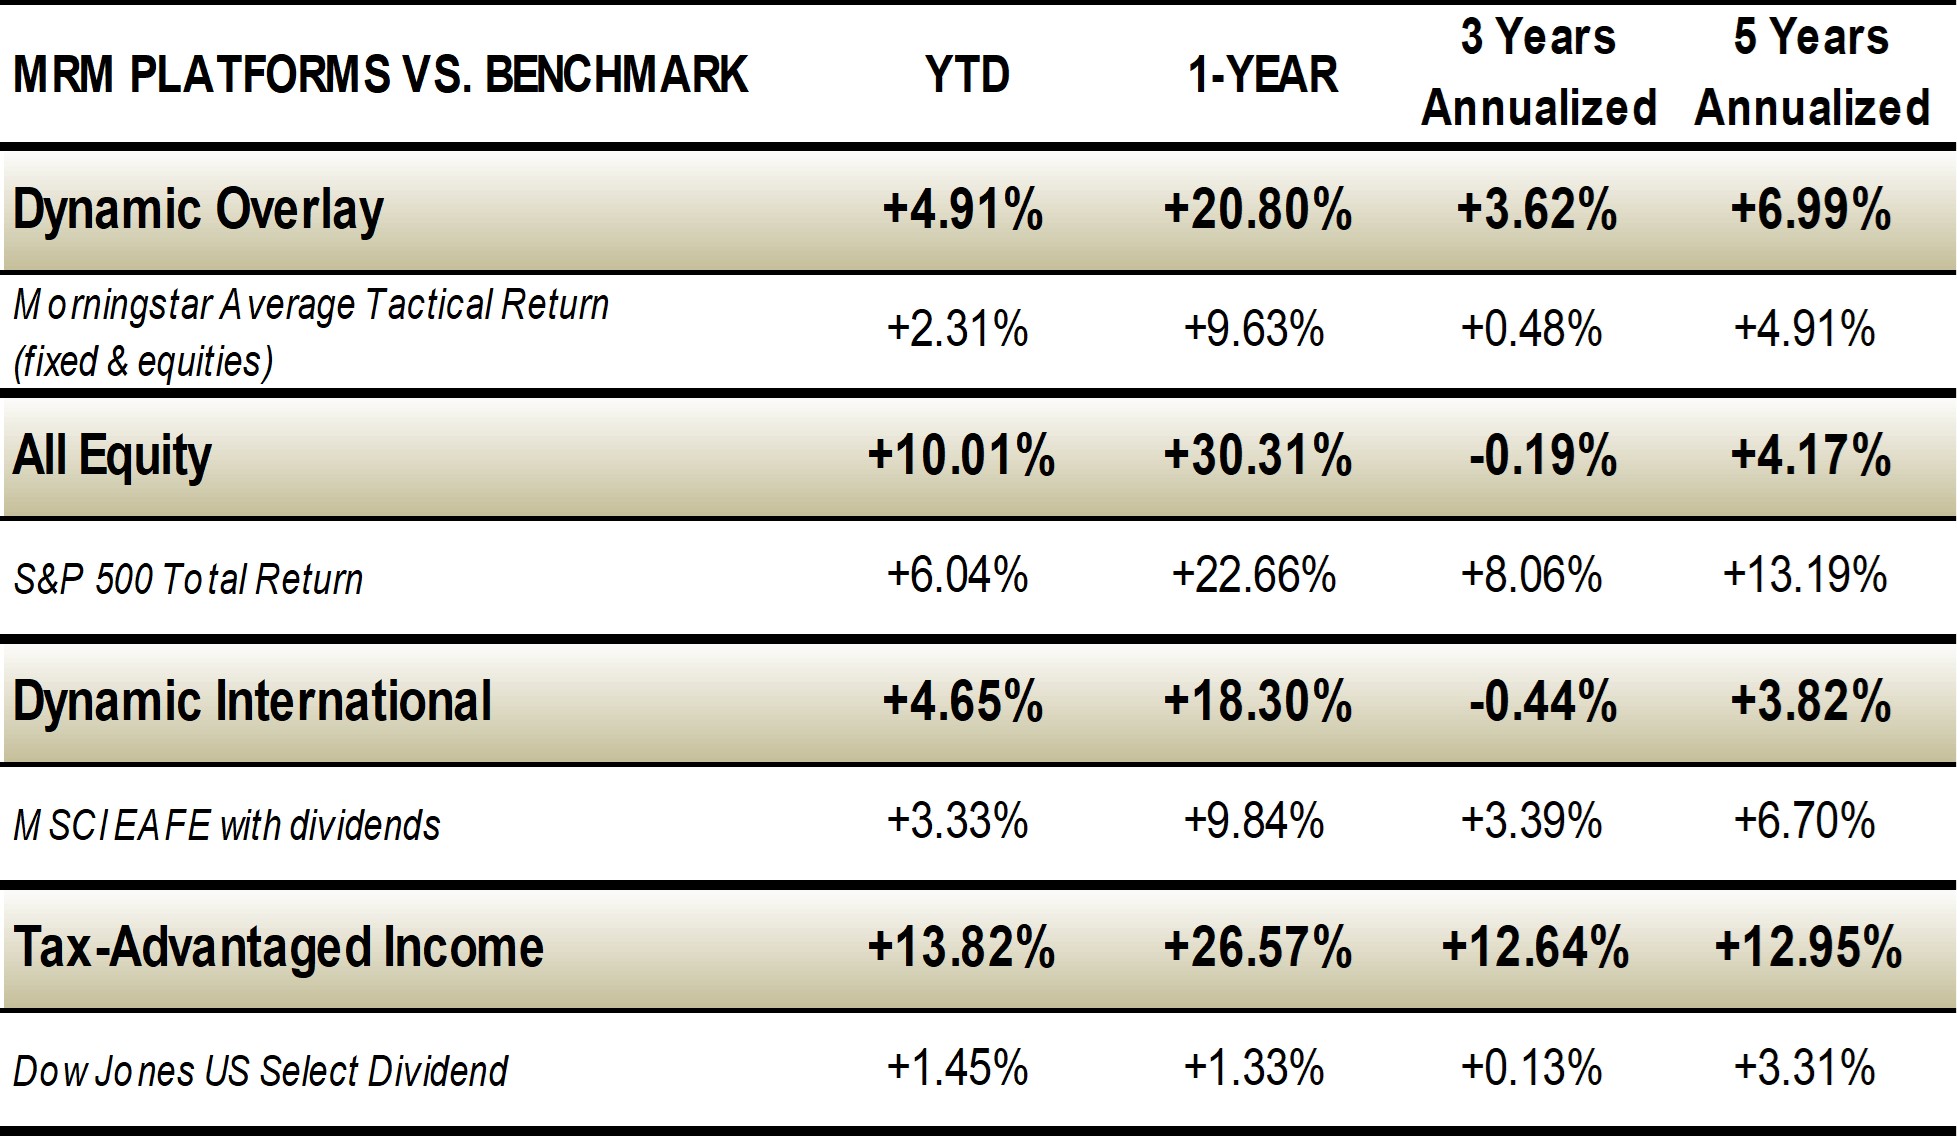
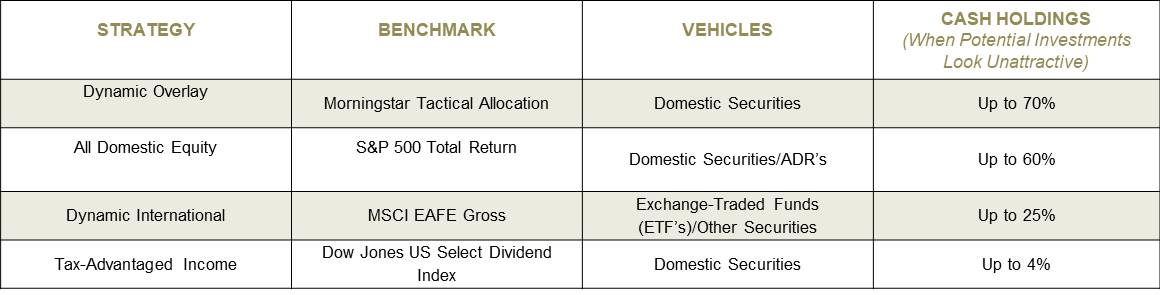
Effective Nov. 1, 2016 the Dynamic Overlay benchmark was changed to Morningstar’s Tactical Allocation. The benchmark was applied retroactively to the beginning of the performance period, January 1, 2008. This change had the net effect of placing the Dynamic Overlay Model Portfolio in a more favorable light than would otherwise have been the case if we used the blended benchmark described below. Although this change had a favorable impact on the comparative effect on the model’s performance but we believe the change in benchmark more appropriately aligns with our Dynamic Overlay Strategy in that it is designed a tactical allocation rather than a static blended benchmark of 75% S&P 500 Index Total Return and 25% MSCI EAFE. Morningstar’s Tactical Allocation Category averages returns for the peer group based on the return of each fund within the group, for the period shown. The S&P 500 Index with dividends is an unmanaged composite of 500 large-capitalization companies whose data is obtained from the Standard & Poor’s website. S&P 500 is a registered trademark of McGraw-Hill, Inc. The MSCI EAFE Gross Index is a free float–adjusted market capitalization index that is designed to measure the equity market performance of developed markets, excluding the U.S. and Canada, with data from the MSCI website using price with reinvestment of dividends. The performance of blended benchmarks is shown for comparison because MRM uses securities which track indices related to these products. The Dow Jones US Select Dividend Index comprises 100 stocks and aims to represent the U.S.’s leading stocks by dividend yield. An investment cannot be made directly into an index.
MRM Group claims compliance with the Global Investment Performance Standards (GIPS®). MRM has been independently verified for the periods January 1, 2008 through December 31, 2024. The verification report is available upon request. Verification assesses whether (1) MRM has complied with all the composite construction requirements of the GIPS standards on a firm-wide basis and (2) MRM’s policies and procedures are designed to calculate the present performance in compliance with the GIPS standards. Verification does not ensure the accuracy of any specific composite presentation.
Valuations are computed and performance is reported in U.S. dollars. Client performance may differ based upon the structure of a particular investment program. For example, some programs are structured as wrap fee programs in which trading costs and brokerage commissions are included in one all-inclusive wrapped fee. As such, these costs may be higher than if the client were to pay trading costs and brokerage commissions separately. The standard management fee is 2.0%. Deviation from the model’s diversified structure may result in different risk, return, and diversification characteristics and would therefore not be representative of the models.
All information contained herein is for informational purposes only. This is not a solicitation to offer investment advice in any state where it would be unlawful. There is no assurance that this platform will produce profitable returns or that any account will have results similar to those of the platform. Past performance is not a guarantee of future results. You may lose money. Factors impacting client returns include individual client risk tolerance, restrictions client may place on the account, investment objectives, choice of broker/dealer or custodians, as well as other factors. Any particular client’s account performance may vary substantially from the program results due to, among other things, commission, timing of order entry, or the manner in which the trades are executed. The investment return and principal value of an investment will fluctuate dramatically, and an investor’s equity, when liquidated, may be worth more or less than the original cost. Investors should consider the investment objective, risks, charges, and expenses carefully prior to investing.
Investors should not rely on charts and graphs alone when making investing decisions. Investments in securities of non-US issuers involve investment risks different from those of U.S. issuers, including currency risks, political, social, and economic risks. Net-of-fees returns are presented after advisor, management, custodial and trading expenses. The net of fee returns are calculated using actual management fees. The actual fees charged vary and range from .5% to 2.2%, depending on the size of the account and the custodian.
If you wish to modify or impose reasonable restrictions concerning the management of your account, or if your financial situation, investment objectives, or risk tolerance have changed, please contact your MRM Group investment advisor representative or contact the Manager at (314) 628-1100. We will contact you at least annually to determine if your investment goals, objectives, and risk tolerance have changed.
All MRM platforms are suitable for long term investing. Please read the fact sheets and disclosures for each platform carefully before investing.
MRM's website provides in certain places information obtained from outside sources or other website addresses or links. The outside information, or any other website information or links, including market and price information, and any other information from outside sources, contains information maintained or provided by institutions or organizations that are independent from the MRM and MRM Entities. MRM does not approve, recommend or have any control over these unaffiliated entities. MRM cannot guarantee or assume any responsibility for the accuracy or completeness of any information provided by any outside organization or entity, and such information is not considered content or images contained on MRM's website. MRM recommends that a user independently review or verify any information provided by any outside source available on MRM's website before acting or relying on such information. If users click on any third party link, any transactions undertaken or information users submit will be subject to the privacy policy of the third party's website(s). For more information, see the resulting third party's privacy policy.